
Oscar Prediction 2020
Oscar winners can be hard to predict, but this document gives at least a few insights on not losing too much in the oscar bid.
With the aim of making predictions for the Oscar Best Picture, I used Python and R to perform web scraping on IMDb and Rotten Tomatoes website, build up machine learning models and conduct text mining on critics reviews.
Lending Club Loan Prediction
Analyzing credit risk to make decisions making for loans is important tasks for financial institutions. With historical data, we can train a model to accurately predict loan default rate.
After the data cleansing and feature selection phase, I built up a logistic regression model to predict the loan default likelihood. Also, I used grid-search cv to improve the model performance and used cross-validation to further validate the model.
All the works are performed in Python and the dataset comes from Kaggle.

A Staggering Exodus into Colombia
Due to the ongoing economic and humanitarian crisis in Venezuela, approximately 1.4 million Venezuelans have fled to Colombia in recent years. In this Tableau visualization report, we are going to provide analysis on where majority of Venezuelan refugees and/or asylum seekers are currently distributed around the globe and how the inflow of Venezuelans has impacted Colombia's economy and societal development.

Glassdoor Review Analysis
Learning the sentiments and topics associate with reviews of employees provided to a third party reviews website like Glassdoor might be useful intelligence for HRs and leaders in understanding its perceived strengths and weaknesses from an unfiltered employee perspective.
Using reviews from Glassdoor, sentiment analysis and topic modeling are conducted to find out the specific topics within a corpus of documents and predict the rating. In addition, a CNN(convolutional neural network) model was built up to predict the ratings based on the given reviews. All the works are performed in R.

WWE Earnings Call Transcript Analysis
In this analysis, I dig into the WWE earnings call transcripts and perform sentiment analysis with various lexicons. In addition, I scraped WWE’s stock prices to analyze the relationship between closing prices and the sentiment scores and try to find out the investment behavior patterns based upon a call. I also created an interactive visualization showing time series trend line under different sentiment scores with plotly. All the works are performed in R.

Spotify Analysis
Music contains so much information. We can not only compare all the hit songs to conclude the popular music trend, but also analyse the song behaviour of a particular person and get to know more about him/her through just a small music application.
This project is divided into two parts. The goal in Part I is to analyze what song characteristics would affect its popularity. To achieve this, I built up a linear mixed model using R.
The goal in Part II is to create a like song prediction system for a specific spotify user. I used R to apply logistic regression model and deployed it in a R Shiny App
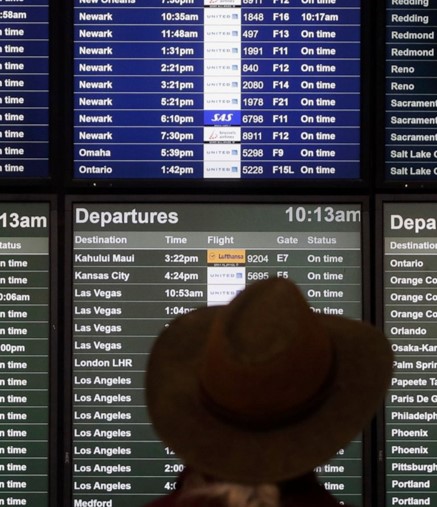
Flight Delays Analysis
Flight delays and cancellations are typical problems all of us face when traveling. In this project I worked with dataset compiled by Kaggle providing summary information on the number of on-time, delayed, canceled, and diverted flights published by DOT’s montly Air Travel Consumer Report for the year 2015.
With the matplotlib and plotly package in Python, I created various visualizations in order to get some insights and recommendationss on the flight delays and cancellation situation.
What Makes An Effective Leader?
Why are some people seen as effective leaders and others are not? Are there any behaviors or characteristics that can help us quantify what an effective leader looks like?
I used the data from a large survey of employees and their direct manager. This data contains individual items and the scale score for those items. The main goal is to use individual items, scale subscores, and/or scale scores to explain the effect variable.
I used R to apply hypothesis testing, power analysis, bootstrap resampling and robust standard error.

Save the Traditional Media Company
Like many traditional media companies, Daily Media Blitz, a media company based in Utah, has been in decline for over a decade. The company hoped to replace the lost print revenue with new streams of revenue coming from the digital agency.
We used Tableau to provide daily in-time dashboards using the daily transactional information (1/1/16 – 5/1/18). We have conducted analyses on health of the sales operation, customer success, salesperson, publication portfolio, and preprint rate.